.png)
.png)
Controls-to-scenarios mapping is a simple way to test whether your continuity controls actually cover the disruption scenarios you say you are prepared for.
In short
Controls-to-scenarios mapping helps teams see which controls support which disruption scenarios, where coverage is thin, and where evidence is missing.
- Map priority scenarios to the controls that should prevent, detect, respond to, recover from, or govern them
- Add evidence so the map shows more than a yes-or-no claim
- Use the result to spot weak coverage, concentration risk, and remediation priorities
That is the practical answer.
You take a defined set of scenarios, map the controls that should prevent, detect, respond to, or recover from each one, and then look for thin spots, overlaps, and unsupported assumptions. It is not a theoretical exercise. It is a working view of coverage.
For a program owner, that matters because one of the recurring problems in BCM is not the lack of controls. It is the lack of visibility into where those controls actually apply, how much confidence to place in them, and where the same scenario depends on too few real safeguards.
What Controls-to-Scenarios Mapping Is
A controls-to-scenarios map is usually a matrix.
The rows are your scenarios. The columns are the controls, or the other way around. The point is not the layout. The point is that each scenario can be traced to the controls that should support it, and each control can be traced to the scenarios it is supposed to help with.
A scenario might be ransomware, regional power loss, cloud provider outage, telecom disruption, or unplanned loss of a critical team. A control might be immutable backup, alternate workspace, vendor failover process, call-tree validation, emergency communications, tabletop exercise cadence, or restoration testing.
This kind of mapping is useful because standards and guidance already expect organizations to identify risks, choose and implement controls, test response and recovery, and monitor what is actually working over time. If you want the deeper risk-monitoring context behind that, NIST SP 800-30 Rev. 1 is a useful reference.
So the map is not a substitute for risk assessment. It is one of the clearer ways to operationalize the results.
Why Coverage Gaps Stay Hidden Without It
A lot of BCM programs say they have “coverage,” but what they really have is a collection of controls and documents that have never been checked against the same set of scenarios in one view.
That is where the blind spots start.
One scenario may depend on three or four controls that have not been tested together. Another may appear covered because a plan exists, but the supporting communications process or third-party dependency control is missing. A third may have several controls on paper, but all of them sit in the same failure path.
That is the operational reason to build the map. It turns a broad statement like “we have controls for this” into a narrower question: which controls, for which scenario, with what evidence, and where is the gap?
This is also where a scenario-based view becomes more useful than a plain control inventory. A control inventory tells you what exists. The map tells you what actually supports a meaningful disruption case.
Related reading
If you are working on evidence, audit readiness, and control visibility, these related articles are useful next steps:
A Practical Way to Build the Map
Start with a short scenario list.
Do not begin with every possible disruption. Pick five to ten scenarios that are already meaningful in your environment. Use recent incidents, BIA findings, third-party dependencies, technology concentration risks, regulatory focus areas, and leadership concerns.
Then choose the control families you want to map. Keep them broad enough to be useful. In practice, that often means categories like governance, communications, backup and recovery, vendor continuity, incident response, alternate work methods, restoration testing, and training or exercises.
For each intersection, ask a simple question: does this control materially support this scenario?
If yes, note the type of support. Prevent, detect, respond, recover, or govern. If partial, say partial. If none, leave it blank or mark it clearly. Then add a final field for evidence. That might be a test result, assessment answer, documented procedure, owner attestation, or recent exercise artifact.
This is where the exercise becomes useful instead of decorative. The map should let you say:
- which scenarios have strong multi-control support
- which scenarios rely on one fragile control
- which controls appear in many scenarios and deserve closer attention
- which items still have no usable evidence
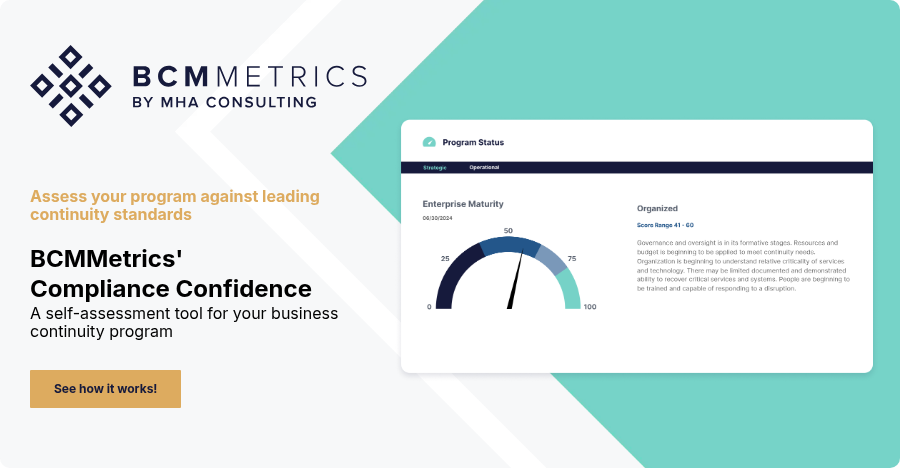
That is also where Compliance Confidence fits naturally. It is useful when the job is not just to identify controls, but to show current status, supporting evidence, and open remediation in one reporting view.

Download a practical companion
If you are trying to make BCM governance, evidence, and follow-through more measurable, download The 2026 BCM Playbook: From Plans to Measurable Progress.
What Good Coverage Looks Like and What Weak Coverage Looks Like
Good coverage does not mean every scenario has the same number of controls.
It means the controls that matter are visible, current, and backed by evidence.
A strong map usually shows layered support for high-priority scenarios. For example, a destructive malware scenario might map to segmented recovery infrastructure, tested backup restoration, incident response escalation, emergency communications, third-party coordination, and tabletop evidence. That is more credible than a single checkmark beside “recovery plan exists.”
Weak coverage usually shows up in three patterns.
The first is scenario concentration.
Too many important scenarios depend on the same untested control or the same team.
The second is evidence weakness.
Controls are claimed, but nobody can point to recent proof.
The third is partial coverage hidden as full coverage.
A scenario has a plan and a control owner, but no recent validation, no third-party dependency check, or no follow-through record.
That is why mapping is useful for program owners. It gives them something they can show upward and manage downward. It supports clearer discussions about what is covered, what is not, and what should be fixed first.
Common Mistakes That Make the Map Less Useful
The first mistake is mapping everything.
If the scenario list is too large or the control set is too detailed, the exercise stalls. Start with priority scenarios and the controls most likely to matter in a real disruption.
The second is treating the map as a one-time artifact.
If scenarios change, dependencies change, or test results change, the map has to move too.
The third is leaving out evidence.
A map without proof becomes another planning document people argue about later.
The fourth is separating the map from remediation.
Once the gaps are visible, they should flow into action tracking, not sit in a slide.
The fifth is confusing control presence with control effectiveness.
A listed control is not the same thing as a working one.
 Conclusion
Controls-to-scenarios mapping is useful because it makes control coverage visible in a way most BCM inventories do not.
It helps you see where scenarios are well supported, where coverage is thin, and where the same few controls are carrying too much weight. It also gives program owners a cleaner way to connect scenarios, evidence, gaps, and follow-up.
That is the real value.
Not a prettier matrix, but a more defensible picture of readiness.
If you are trying to make BCM governance, evidence, and follow-through more measurable, The 2026 BCM Playbook: From Plans to Measurable Progress is a useful next step.
If you need a better way to assess controls, attach evidence, show gaps, and report progress without stitching it together manually, Compliance Confidence is the BCMMetrics module built for that kind of work.
Request a demo if you want a closer look at how teams keep control evidence, gap visibility, and remediation reporting more connected.
FAQ
What is controls-to-scenarios mapping?
Controls-to-scenarios mapping is the practice of linking defined disruption scenarios to the controls that should prevent, detect, respond to, recover from, or govern them. It helps teams show coverage and identify gaps.
How do you map BCM controls to scenarios?
Start with a short list of priority scenarios, choose the key control categories, then document which controls materially support each scenario and what evidence proves that support.
What does a coverage gap mean in BCM?
A coverage gap means a scenario has weak, partial, outdated, or unsupported controls. It may also mean the control exists on paper but lacks current evidence or recent validation.
How often should a controls-to-scenarios map be updated?
It should be updated whenever major scenarios, dependencies, controls, test results, or remediation status change. At a minimum, it should be revisited as part of regular governance and review cycles.